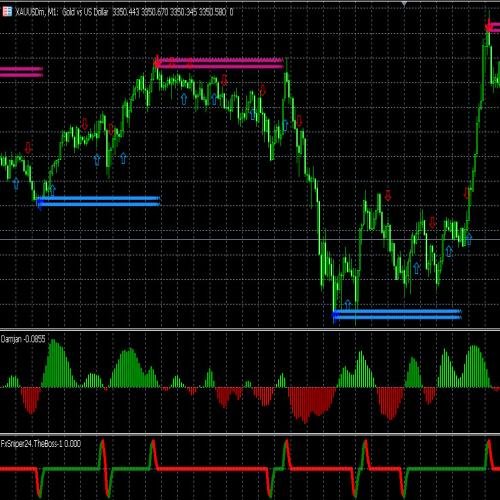
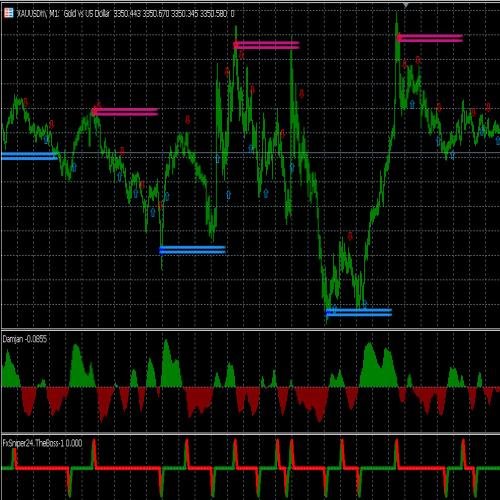
The S & D Indicator maps out where aggressive buying and selling previously stepped in and then projects those areas forward so you can trade with structure instead of chasing candles. As price builds swing highs/lows, the tool identifies potential imbalances and draws clear zones: demand (likely support) and supply (likely resistance). When price revisits a zone, you’ll see clean on‑chart cues (arrows) that make reaction trades easier to spot in real time.
This is especially helpful on fast markets like Gold (XAUUSD) and major FX pairs. Many traders use the indicator to:
-
1. mark zones during quiet periods,
-
2. wait for a tap or shallow pullback, and
-
3. enter with stops tucked just beyond the zone and targets at the next opposing area.
You can tailor sensitivity to show only the most recent levels or a broader map of structure, and restyle colors/thickness to fit your chart. The indicator does not place trades—pair it with your risk rules and (optionally) a momentum filter to confirm bounces or breaks. Always forward‑test on a demo before going live.


